Part A: Familiarization with FT of different 2D patterns
In this part, we created 2D patterns and then took their FT's and see what it looks like.
Square:
 square pattern and its FT
Annulus (Donut):
 Annulus pattern and its FT
 Annulus pattern and its FT
Square annulus:
 square annulus and its FT
Two slits along the x-axis symmetric about the center:
 double slit pattern along x-axis and its FT
Two dots along x-axis symmetric about the center:
 Two dots (1 pixel) along x-axis pattern and its FT
 different FT pattern if dots are not of 1 pixel
Part B: Anamorphic property of the Fourier Transform
First, we're asked to make a 2D sinusoid in the x direction (like a corrugated roof) and take it's FT:
 sine wave (f=2Hz) and its FT
Next we change the frequency of the sinusoid:
 f = 4 Hz
 f = 8 Hz
 f = 16 Hz
As the frequency of the sine wave is increased or decreased, the two peaks in the frequency space moves farther apart or closer together, respectively. This is because low frequencies are close to the center (zero) in frequency space and as you move away from the center, the frequency increases.
Adding a bias to the sinusoid and taking the FT:
 sinusoid with bias and its FT
Adding a bias to the sinusoid and taking the FT:
 sinusoid with bias and its FT
By adding the bias, the sinusoid now oscillates with non-negative values. However, we can see that there's an additional peak right in the middle of its FT. Digital images have no negative values so for example, what I can do to find the actual frequencies of the interferogram from Young's double slit experiment is to DC-filter it first. DC filtering will remove the bias and hence the middle peak in the FT. If the bias is non-constant, e.g. low frequency sinusoids, I can still get the frequencies of the interferogram by applying a high pass filter. This way, the low frequencies (the noise in this case), will be removed.
Next, we rotate the sinusoid and take its FT:
 rotated 30 degrees
Next, we rotate the sinusoid and take its FT:
 rotated 30 degrees
 rotated 45 degrees
Rotating the sinusoid also amounts to rotating their FT by the same amount. This is a unique property of the 2D FT compared to the 1D FT.
Next, we created a pattern which is a combination of sinusoids in the X and Y direction, take its FT and see what it looks like:
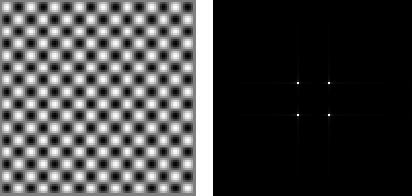 combination of sinusoids in the X and Y and its FT
Then we add several rotated sinusoids in the pattern. I added two sinusoids: 1 rotated by 30 degrees and another one rotated by 45 degrees. Since I know that rotating the sinusoids will also rotate their FT, the FT's of the added sinusoids individually are shown in the last part. At first I predict that adding the sinusoids would result in a rotation of the FT of the "eggcart". But remembering that the FT is a linear transformation, the FT of the result should be the addition of the FT's of the components. Therefore, the resulting FT should be something like 4 peaks on the corners of a square, then two peaks tilted at 30 degrees and another 2 peaks tilted 45 degrees. Checking this prediction:

Indeed, the resulting FT is the same as the prediction! :D
Rating myself, I would give myself a 10/10 for understanding the lesson and producing the required outputs.
Score: 10/10
Lastly, I would like to acknowledge Dr. Soriano, BA Racoma and Androphil Polinar
for the helpful discussions.
- Dennis
References:
1. M. Soriano, "A7 - Properties of the 2D Fourier Transform"
No comments:
Post a Comment