Part A. Convolution Theorem
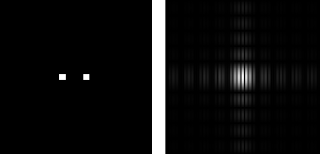
For this part we're first asked to make certain patterns and take their FT's.
Two dots along x-axis symmetric about the center:
Two circles along x-axis symmetric about the center:
 Increasing the radius...


Note that by just adding a small finite radius to the dots, the FT immediately changes such that it is now a combination of an Airy disk with a sinusoid running along x-axis. This is because the FT of two peaks symmetric along the x-axis is a sinusoid while the FT of a circle is the Airy disk. The pattern is a convolution of the two peaks with the circle. Therefore, the FT modulus seen is a product of the sinusoid with the Airy disk. Furthermore, as we increase the radius of the dots, the Airy disk becomes smaller and smaller.
Two squares along x-axis symmetric about the center:
Increasing the width...


This pattern is again a convolution of two dirac delta's or peaks with a square aperture. Therefore, the FT modulus should be the product of a sinusoid with the cross-like rectangular patterns (FT of square aperture) and this is what we got. Increasing the width of the squares would make the rectangular pattern smaller (a property of FT's).
Two gaussians along x-axis symmetric about the center:
Increasing the variance...


This pattern is a convolution of two dirac delta's and a gaussian. The peaks are spaced futher apart therefore the lines are much closer together. The FT of a gaussian is still a gaussian so the FT modulus is the product of the sinusoid and the gaussian as seen in the figure. Increasing the variance of the gaussian leads to a smaller gaussian in the FT modulus.
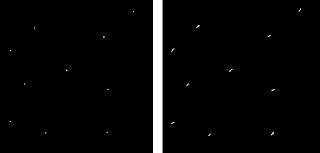
Next, we're asked to create a 200 x 200 array with ten 1's randomly located. Also, we made a 3x3 pattern of
[0 0 1]
0 1 0
1 0 0]
The dots are now replaced with the 3x3 pattern.
Then, we create a 200 x 200 array with equally spaced 1's along the x and y axis. We vary the spacing of the 1's and then see what happens in the FT modulus:
 grid pattern (left) and its FT (right). width = 5
 grid pattern (left) and its FT (right). width = 20
 grid pattern (left) and its FT (right). width = 40
It is observed that the closer the 1's are spaced, the farther apart they are in frequency space, which is consisted with the inverse property of FT.
Part B. Fingerprints: Ridge Enhancement
For this part we'll be enhancing the ridges of the fingerprints by filtering in frequency space.
I'm going to use this fingerprint that I got from the manual:
The fingerprint reminds me of sine waves that are propagating in all direction (2D) and it's like a ripple. So I thought: If you rotate the two peaks (FT of sinusoid) in all directions then you would get an annulus.
It's FT is the left figure and information is contained mostly in the bright annulus. So I designed the filter to let this part pass through as well as the center spot. Removing the center spot will invert the image (black --> white and white --> black) since 0's and 1's are interpreted as black and white respectively in scilab. Multiplying this filter or mask to the FT of the fingerprint and then inverse FT-ing results in:
The black blotches that were present in the original (left) are now greatly reduced in the frequency filtered image (right). Putting a threshold or converting this to binary, we can see the effect of filtering more clearly:
We can see that the blotches are removed and the ridges are enhanced. :)
Part C. Lunar Landing Scanned Pictures: Line Removal
Basically we're asked to remove the vertical lines in the picture caused by piecing together individual pictures into a composite one.
It's FT is shown on the right and since the vertical lines are equally spaced, we can think of this as a sinusoid. Therefore, the frequency components that make up these vertical lines belong to the horizontal bright line in the FT. Therefore I designed my filter to be:

and applying this, I get:

and the vertical lines are gone! The left one is the original while the right figure is the filtered one. :)
Part D. Canvas weave modeling and Removal
For this part, we're asked to remove the canvas weave patterns by filtering in the frequency domain.
The FT of the picture is shown in the left figure. Note that there are bright horizontal and vertical lines as well as some bright peaks. The canvas weaves are like grids so they can be thought of sine waves in the horizontal and vertical so I designed my mask to "cover" them as shown in the right. And after applying the filter, what I got is:
Voila! The canvas weave patterns are gone! :D :D Also, the brushstrokes in the painting seems to have been enhanced as compared to the original.
Lastly, we invert the filtering mask and then take it's inverse FT. What I get is:
Cool pattern! Not only that, it looks like the canvas weave pattern in some way because it has grids too. :D
Grading myself, I give a 10/10 for understanding the lesson and producing the required outputs (whew!)
Score: 10/10
Finally, I would like to acknowledge Dr. Soriano, Tisza Trono, Arvin Mabilangan, BA Racoma and Joseph Bunao for the helpful discussions. :D
References:
1. M. Soriano, "A8 - Enhancement in the Frequency Domain"
Appendix: (Code) (There are missing semi-colons and slash because i removed them. This blog sometimes just won't display the codes correctly.)
nx = 256;
ny = 256;
x = linspace(-128,128,nx);
y = linspace(-128,128,ny);
[X,Y] = ndgrid(x,y);
// two dots
A = ones(nx, ny);
A(find(Y>20)) = 0;
A(find(Y<19))>1)) = 0;
A(find(X<-1)) = 0; two circles r= sqrt(X.^2 + Y.^2); A = zeros (nx,ny); A(find((X.^2 + (Y+20).^2) < a =" ones(nx,">25)) = 0;
A(find(Y<15))>5)) = 0;
A(find(X<-5)) = 0; two gaussians nx = 256; ny = 256; x = linspace(-1,1,nx); y = linspace(-1,1,ny); [X,Y] = ndgrid(x,y); r= sqrt((X.^2 + (Y+0.4).^2)/0.0001); A1 = exp(-r); r= sqrt((X.^2 + (Y-0.4).^2)/0.0001); A2 = exp(-r); A = A1 + A2; grid A = zeros(200, 200); width = 5; for i = 1:width:200 for j = 1: width:200 A(i, j) = 1; end end For Part B: nx = 419; ny = 581; x = linspace(-1,1,nx); y = linspace(-1,1,ny); [X,Y] = ndgrid(x,y); r= sqrt(X.^2 + Y.^2); finger = gray_imread("C:\fingerprint.jpg"); FTfinger = fftshift(fft2(finger)); mask = ones(nx, ny); mask = zeros(nx, ny); mask(find(r<0.20)) a =" FTfinger" b =" im2bw(finger," c =" im2bw(abs(ifft(A))," a =" gray_imread(" fta =" fftshift(fft2(A));" nx =" 480;" ny =" 640;" x =" linspace(-1,1,nx);" y =" linspace(-1,1,ny);" mask =" ones(nx,">0.10)) = 0;
mask(find(abs(X)>0.045)) = 1;
C = FTA .* mask;
scf();
imshow(log(abs(C)+0.1), []);
scf();
imshow(A, []);
scf();
imshow(abs(fft2(C)),[]);
For Part D:
nx = 419; ny = 581; //defines the number of elements along x and y
x = linspace(-1,1,nx); //defines the range
y = linspace(-1,1,ny);
[X,Y] = ndgrid(x,y);
r= sqrt(X.^2 + Y.^2);
mask1 = ones(nx, ny);
mask1(find(abs(Y)<0.02)) = 0;
mask1(find(abs(X)<0.04)) = 1;
mask2 = ones(nx, ny);
mask2(find(abs(X)<0.02)) = 0;
mask2(find(abs(Y)<0.04)) = 1;
mask = ones(nx, ny);
mask(find((Y.^2 + (X+0.43).^2) < 0.0004)) = 0;
mask(find((Y.^2 + (X-0.43).^2) < 0.0004)) = 0;
mask(find((Y.^2 + (X+0.205).^2) < 0.0004)) = 0;
mask(find((Y.^2 + (X-0.205).^2) < 0.0004)) = 0;
mask(find(((Y+0.31).^2 + X.^2) < 0.0004)) = 0;
mask(find(((Y-0.31).^2 + X.^2) < 0.0004)) = 0;
mask(find(((X+0.1).^2 + (Y-0.16).^2) < 0.0004)) = 0;
mask(find(((X-0.1).^2 + (Y-0.16).^2) < 0.0004)) = 0;
mask(find(((X+0.1).^2 + (Y+0.16).^2) < 0.0004)) = 0;
mask(find(((X-0.1).^2 + (Y+0.16).^2) < 0.0004)) = 0;
//scf();
//imshow(log(abs(FTA)+0.1),[]);
C = FTA .* mask2 .* mask1 .* mask;
scf();
imshow(log(abs(C)+0.1), []);
scf();
imshow(A, []);
scf();
imshow(abs(ifft(C)),[]);


No comments:
Post a Comment