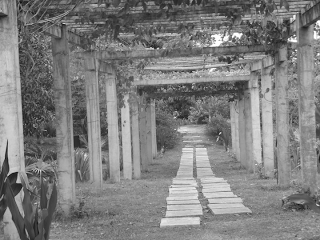
I've chosen this picture:

and I ran the following code in Scilab:
stacksize(10000000);Basically what this code does is it loads the image into scilab, then it gets the image's normalized histogram and CDF. Then, it interpolates in order to get the y values in the image's CDF. After that it interpolates once again in order to get the grayscale value having this CDF value in the desired CDF. All the pixels in the image are backprojected and replaced by the x-values of the desired CDF.
A = gray_imread("C:\test1.jpg");
B = tabul(A, "i");
B1 = B(:,1);
B2 = B(:,2);
size(A);
s = 540*720;
B2norm = B2/s;
B2cumsum = cumsum(B2norm);
A1d = A(:);
yCDF = interp1(B1, B2cumsum, A1d);
xdesired = interp1(B1, B1, yCDF);
Aedited = matrix(xdesired, [540, 720]);
imwrite(Aedited, "C:\test1modified.png");
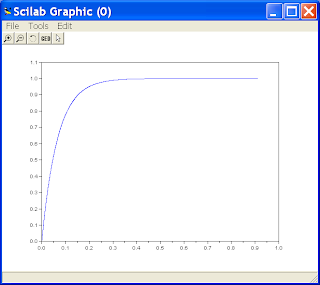
In this case, the desired CDF is a line with slope = 1, that is, its PDF is just a uniform distribution. Executing the code above, I get:
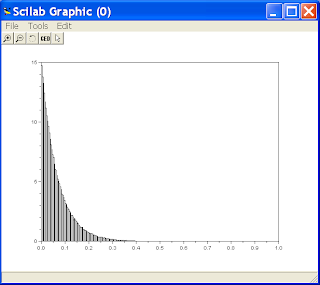
 histogram of the image (not normalized)
 normalized histogram of the image
 Histogram equalized image
 Original grayscaled image
and comparing the CDF's before and after:
 CDF before enhancement
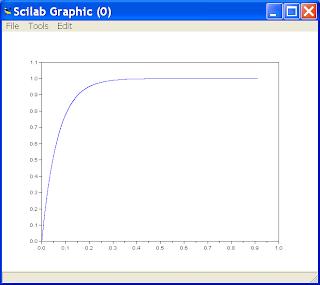
 CDF after enhancement
 PDF after enhancement
 CDF before enhancement
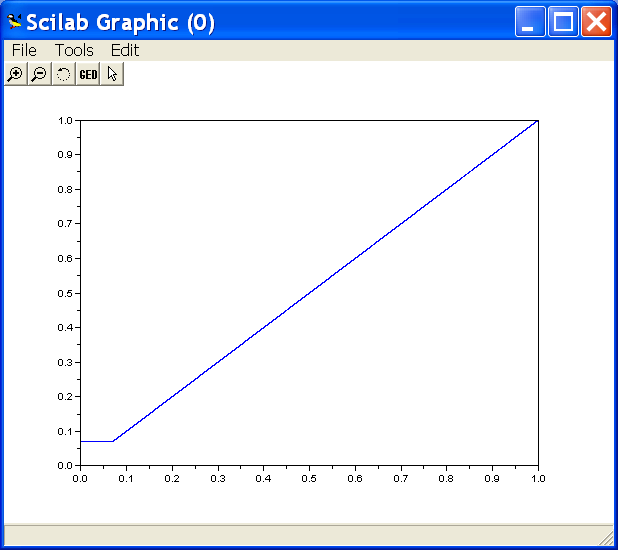 CDF after enhancement
 PDF after enhancement
It is noticeable that the modified image has a higher contrast than the original. The light colored pixels seem to become lighter and the dark pixels seem to become darker. It also looks like that the "gray fog" over the original picture has been removed. The image is called histogram equalized image because we have modified its histogram such that every gray level the original image possess now have equal probability. Thanks to this, the picture is now brightened up a bit. :)
Also, the CDF of the enhanced image is a straight line and that was our desired CDF. Note that there's a small horizontal segment. This is because in the histogram of the original image, there's a range of grayscale values where no or very little pixels possess. This can also be seen in the modified PDF.
Next, I tried the technique on different CDF's. The first one is normal distribution: (mean = 0.5, std = 0.1)
 histogram of normal distribution
 CDF of normal distribution
The code was slightly changed:
A = gray_imread("C:\test1.jpg");
B = tabul(A, "i");
B1 = B(:,1);
B2 = B(:,2);
size(A);
s = 540*720;
B2norm = B2/s;
B2cumsum = cumsum(B2norm);
A1d = A(:);
y = grand(1, s, 'nor', 0.5, 0.1);
C = tabul(y, "i");
C1 = C(:,1);
C2 = C(:,2);
C2norm = C2/s;
C2cumsum = cumsum(C2norm);
yCDF = interp1(B1, B2cumsum, A1d);
xdesired = interp1(C2cumsum, C1, yCDF);
Aedited = matrix(xdesired, [540, 720]);
imwrite(Aedited, "C:\test1modified.png");
And the resulting image is:
 Histogram manipulated imageOriginal image
Personally, I don't think using the histogram manipulated image is of better quality than the original image; it looks more hazy and less contrasted than the original. This is because for the normal distribution, most of its elements are concentrated near the mean and the standard deviation used here is quite small, meaning the pixels are concentrated around a range of graylevel values, which explains image's low contrast.
Like our first case, the histogram and CDF of the modified image resembles the desired one:
 histogram of modified image
 CDF of modified image
Like our first case, the histogram and CDF of the modified image resembles the desired one:
 histogram of modified image
 CDF of modified image
Next, I tried the exponential distribution:
 Histogram of exponential distribution
 CDF of exponential distribution
 Histogram of exponential distribution
 CDF of exponential distribution
And the result is:
 histogram manipulated image
 original image
 histogram manipulated imageoriginal image
The manipulated image appears a lot darker than the original image because due to the exponential distribution, the pixels are concentrated at the left of the histogram, meaning there are now more pixels having darker values.
And the histogram and CDF of the modified image are:
 histogram of manipulated image
 CDF of manipulated image
And the histogram and CDF of the modified image are:
 histogram of manipulated image
 CDF of manipulated image
Lastly, I used Photoshop to manipulate the histogram of the image:
 Using Photoshop to manipulate the CDF
 histogram manipulated image
original image
The image now is of higher contrast and it looks better! For me, its quality is better than the other histogram manipulated images. :D
For the score, I give myself 10/10 for understanding the lesson and being able to produce the requirements.
Score: 10/10
Finally, I would like to thank Dr. Soriano, Joseph Bunao, Arvin Mabilangan, BA Racoma, and Andy Polinar for the insightful and helpful discussions.
References:
1. M. Soriano, "A5 - Enhancement by Histogram Manipulation"
 Using Photoshop to manipulate the CDF
 histogram manipulated imageoriginal image
The image now is of higher contrast and it looks better! For me, its quality is better than the other histogram manipulated images. :D
For the score, I give myself 10/10 for understanding the lesson and being able to produce the requirements.
Score: 10/10
Finally, I would like to thank Dr. Soriano, Joseph Bunao, Arvin Mabilangan, BA Racoma, and Andy Polinar for the insightful and helpful discussions.
References:
1. M. Soriano, "A5 - Enhancement by Histogram Manipulation"
No comments:
Post a Comment